Use FMEA without false precision
Apply a transparent scoring exercise and recognize its limits.
2.0 minutes · English captions · Transcript + illustrated learning notes
This lesson has required companion reading below, including material not spoken in the video. Complete it before the assessment.
English captions available in the video player.
Narration and visual explanations
This transcript represents the recorded lesson using conventional written abbreviations and numerals. Open View technical information to see each diagram and its explanation. This lesson has required companion reading below, including material not spoken in the video. Complete it before the assessment.
A tool, not the decision
View technical information · Diagram 1
Lesson explanation
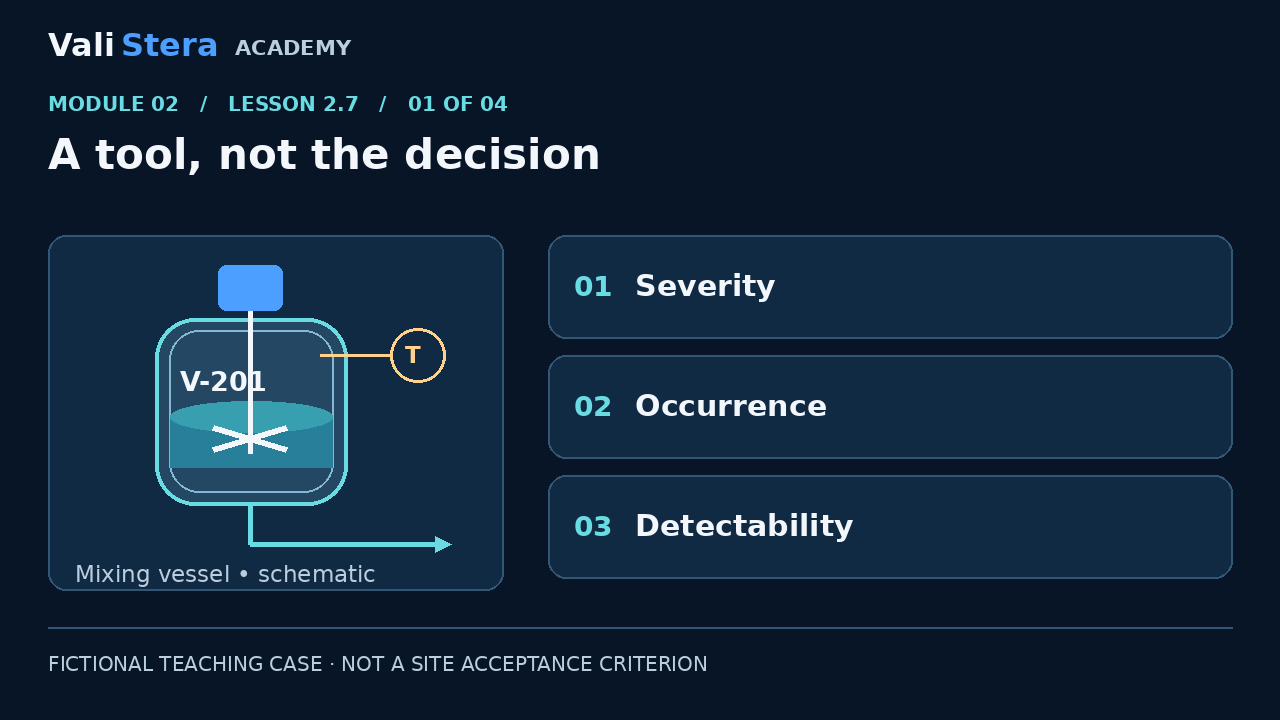
Failure mode and effects analysis, often called FMEA, can organize a discussion. This course uses a fictional three-level scale for severity, occurrence and difficulty of detection. These numbers are ordinal teaching categories, not measured probabilities. They are not official regulatory limits. The interactive exercise makes the arithmetic visible while keeping the rationale and unresolved high-severity concerns beside the result.
Define the scales first
View technical information · Diagram 2
Lesson explanation
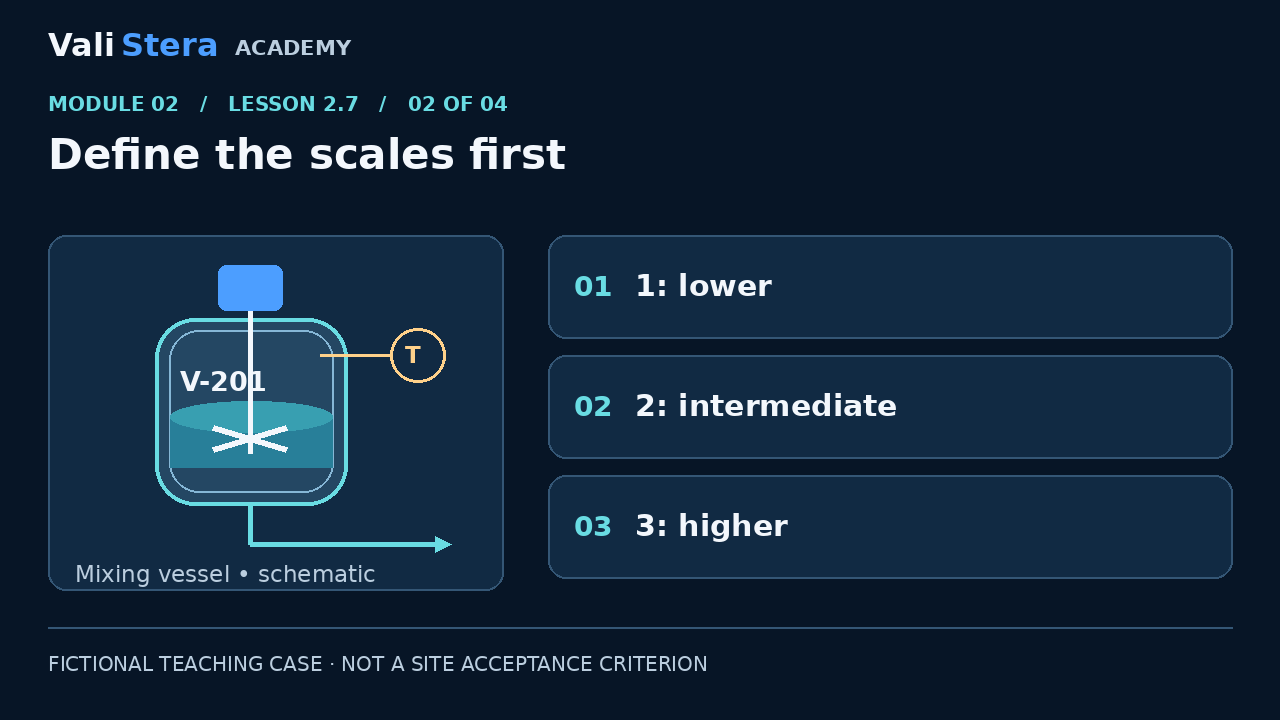
In this exercise, higher severity means more serious potential harm. Higher occurrence means the failure is more plausible given the available evidence. Higher detection score means it is harder to discover the failure before its consequence. Real projects need operational definitions tailored to the scenario. A team should agree those definitions before scoring. The labels lower and higher alone are not sufficient for an approved site assessment.
Equal products, different stories
View technical information · Diagram 3
Lesson explanation
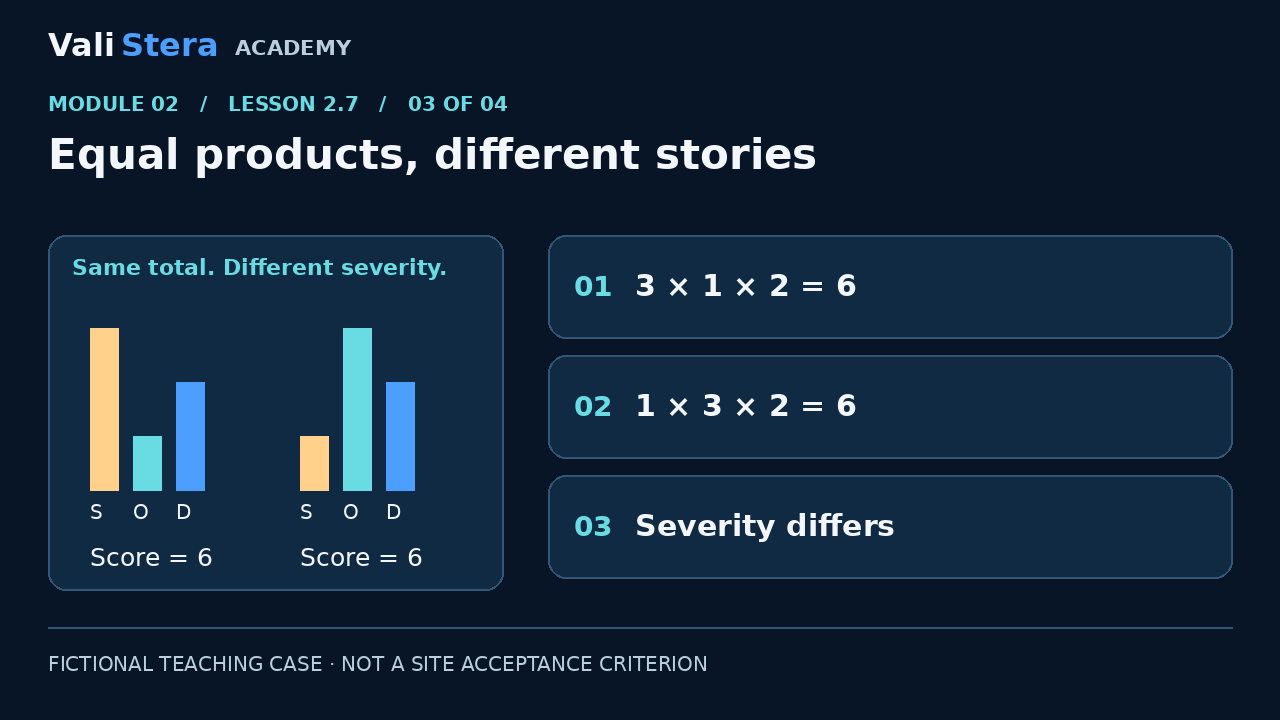
Multiply three by one by two and the result is six. Multiply one by three by two and the result is also six. Yet the first scenario has a higher severity category. The chart shows equal total scores with different component patterns. Equal products do not establish equivalent risk or acceptable controls. Review the scenario, severity, uncertainty and control options rather than letting one number decide.
Re-score after evidence
View technical information · Diagram 4
Lesson explanation
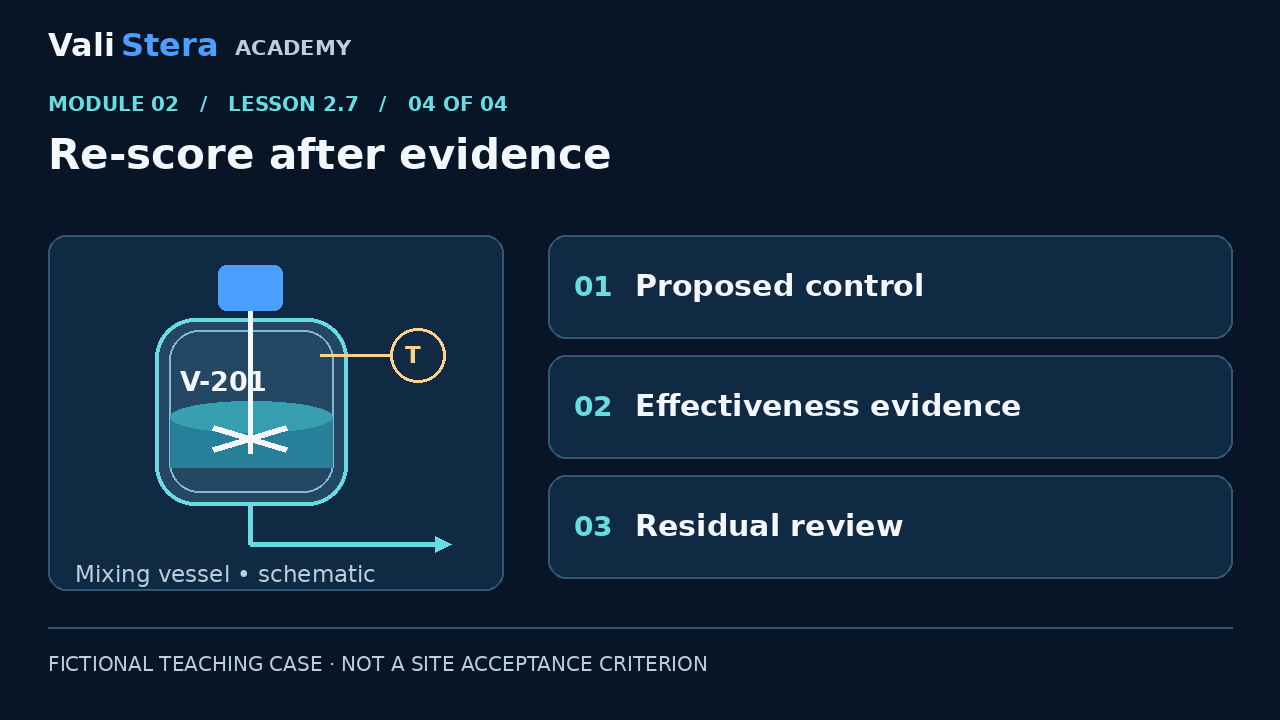
Suppose an independent alarm is proposed. Do not lower the detection score merely because the alarm appears on a drawing. Determine whether it detects the relevant failure, whether someone will respond and whether that response is timely. Verify the control and reassess residual risk. The activity asks you to compare two scoring rationales and explain which assumptions need evidence. No score in this lesson automatically authorizes release.
Worked artefact: FMEA with defined teaching scales
The following ordinal scales belong only to this fictional exercise. Numbers rank categories; multiplying them does not produce a measured probability or a calibrated amount of risk. Equal products can hide different severity. No automatic acceptance cutoff is used.
| Score | Severity (S) | Occurrence (O) | Detection difficulty (D) |
|---|---|---|---|
| 1 | No expected quality effect in the stated scenario | Relevant evidence supports an infrequent failure | Independent verified detection prevents transfer |
| 2 | Quality failure requiring batch investigation | Failure is plausible; limited relevant history | Detection depends on operator intervention |
| 3 | Potential incorrect dose and patient harm | Repeated failures in relevant history | No effective detection before transfer |
Unknown frequency is marked uncertain; it must not silently receive O=1.
| FMEA field | Filled teaching row |
|---|---|
| Failure / cause / effect | Agitator stops because a drive trips → concentration may vary → possible incorrect dose. |
| Current controls / evidence | Operator observes speed display; the display does not prove uniformity. No relevant reliability history supplied. |
| Scores / rationale | S=3 for potential dose harm; O=2 provisionally for a plausible failure with limited history; D=2 because operator response is required. Product=12, an ordinal prioritization aid only. |
| Action / owner | Engineering proposes independent low-speed detection with transfer inhibition; validation challenges detection and response before reliance. |
| Residual assessment | Pending effectiveness evidence. Do not lower S merely because an alarm is added. Reassess O/D using evidence; Quality reviews the remaining risk. |
| Review trigger | New product, changed drive/control logic, an undetected stop, or new reliability evidence. |
Try the explorer using 3, 2, 2. Then compare 3×1×2 with 1×3×2: both equal 6, but the possible harm differs.
Risk-score explorer
This arithmetic demonstration has no acceptance threshold. Higher detection score means harder to detect. Scores require scenario-specific definitions and evidence in real work.
1 × 1 × 1 = 1
This score is not a release decision. Review severity, uncertainty and control effectiveness.
Apply it · Activity 7
Use the interactive score explorer. Compare 3×1×2 with 1×3×2 and explain why a single threshold is insufficient.
Compare with model reasoning
Both equal 6, but severity differs. Prioritize the full failure scenario and evidence; examine uncertainty and control effectiveness. Do not infer an official acceptance threshold from the exercise.